Poland's grid at 46% renewable — what a year of 15-minute data reveals
I analyzed 365 days of Polish grid data at 15-minute resolution. Poland is already at 46% renewable share — and the data challenges several popular assumptions about intermittency, costs, and the optimal energy mix.
Poland’s energy transition is further along than most people think. I downloaded a year of system data from PSE (the Polish grid operator) and URE (the energy regulator) and crunched the numbers. 35,040 data points at 15-minute resolution, April 2025 through April 2026.
The headline: renewables already cover 45.8% of Poland’s electricity demand on average. Over a third of all hours, that number exceeds 50%. On one sunny Sunday in April 2026, it briefly hit 103%.
Here’s what else the data shows — some of it surprising.
The data
Two public datasets, both freely available:
- URE capacity register (Dec 31, 2025): 10,137 individual renewable installations across Poland, with location, type, and capacity.
- PSE system totals (Apr 2025 – Apr 2026): 15-minute snapshots of solar generation, wind generation, total renewable generation, demand, and total generation. 96 snapshots per day, 365 days.
Both are available from energia.ure.gov.pl and dane.pse.pl respectively. The analysis was done in R with tidyverse.
First catch: Poland has no offshore wind
The URE registry lists a category called WS with 12,876 MW of capacity. I initially assumed this was “Wind Shore” (offshore wind). It’s not. WS stands for Współspalanie — biomass co-firing in coal power plants. These are coal units that burn some biomass alongside coal; the URE registers their full nameplate as “renewable,” even though only a fraction of their output is actually from biomass.
Poland had zero operational offshore wind as of December 2025. The Baltic Sea projects are still under construction.
This matters because using the wrong denominator for wind capacity factors gives wildly misleading results. With the corrected capacity (onshore wind only = 10,976 MW), Poland’s wind capacity factor is 21.8% — reasonable for a country with mean wind speeds of 6-7 m/s at hub height. Using the inflated number gives 10%, which would wrongly suggest Polish wind is barely viable.
Lesson: always check what the abbreviations actually mean. The URE registry uses Polish codes (WIL = Wiatr na Lądzie, onshore wind; WS = Współspalanie, co-firing), and the English translations aren’t always obvious.
Poland’s renewable capacity: 25 GW of the real stuff
After removing the co-firing capacity, here’s what Poland actually has:
| Source | Capacity | Share |
|---|---|---|
| Solar (PVA) | 11.6 GW | 45.8% |
| Onshore Wind (WIL) | 11.0 GW | 43.4% |
| Biomass | 1.2 GW | 4.7% |
| Hydro | 1.0 GW | 3.9% |
| Biogas + Other | 0.6 GW | 2.2% |
| Total dedicated | 25.3 GW |
The roughly 50/50 solar-wind split turns out to be close to optimal, as we’ll see below.
Finding 1: 46% renewable share, and growing
On average, renewables covered 45.8% of Polish electricity demand over the year. The monthly breakdown shows clear seasonality:
| Best months | Worst months |
|---|---|
| June: 54.8% | November: 38.8% |
| April: 52.1% | December: 41.7% |
| May: 50.0% | February: 42.0% |
June peaks because of long days (maximum solar hours) plus decent wind. November is the trough — short days, occasional wind lulls.
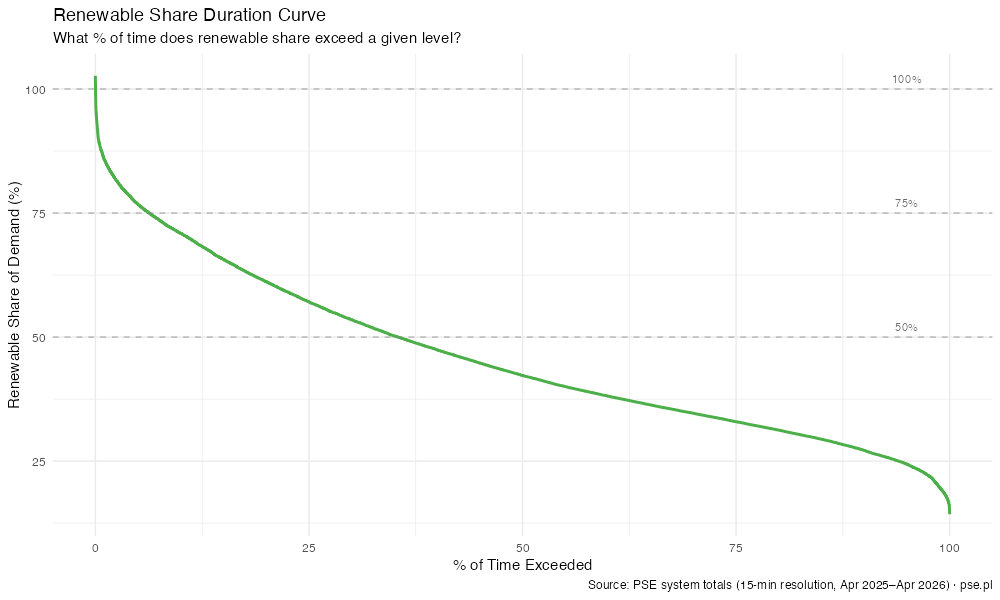
For 35% of the year (3,086 hours), renewables exceeded 50% of demand. For 275 hours, they exceeded 80%. On April 5, 2026 — a sunny Sunday with low demand — they briefly hit 103%, meaning Poland momentarily generated more renewable electricity than it consumed.
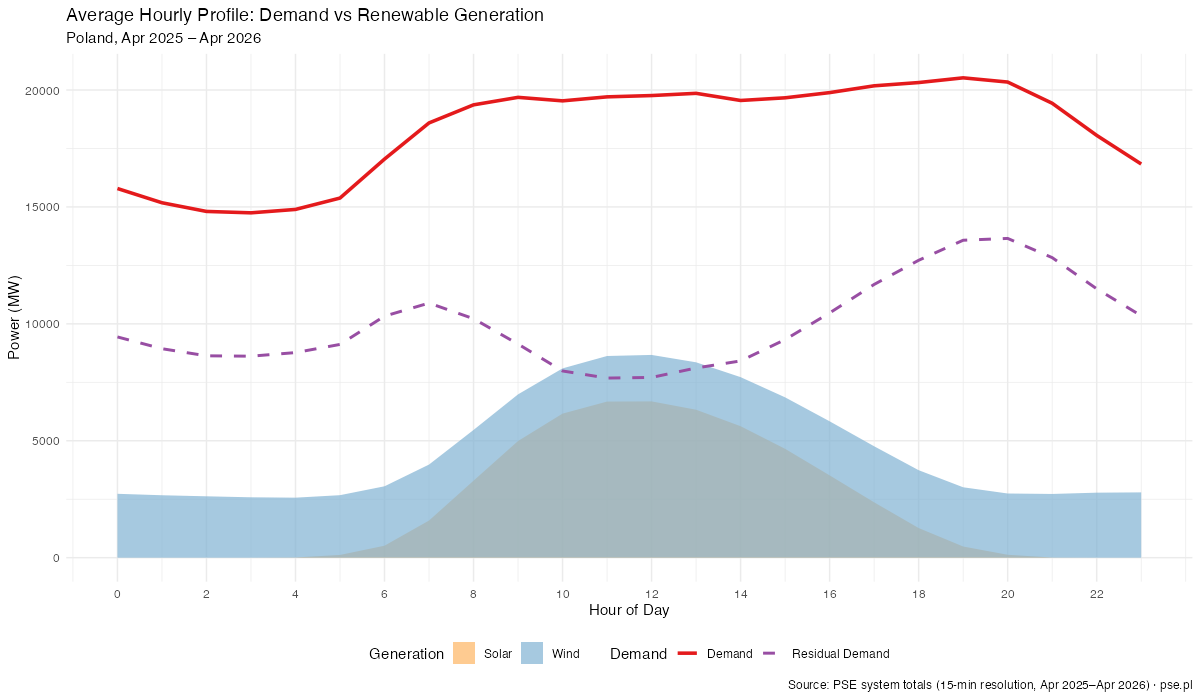
The average hourly profile tells the story: renewables cover 55-58% of demand during the solar peak (9:00-12:00), but drop to ~35% in the evening when solar fades and demand stays high. That evening gap is the hardest to fill.
Finding 2: The merit-order effect is massive
This is the big one. I joined the generation data with PSE’s day-ahead auction prices (CSDAC) and found a strong negative correlation (r = -0.68) between renewable share and spot price.
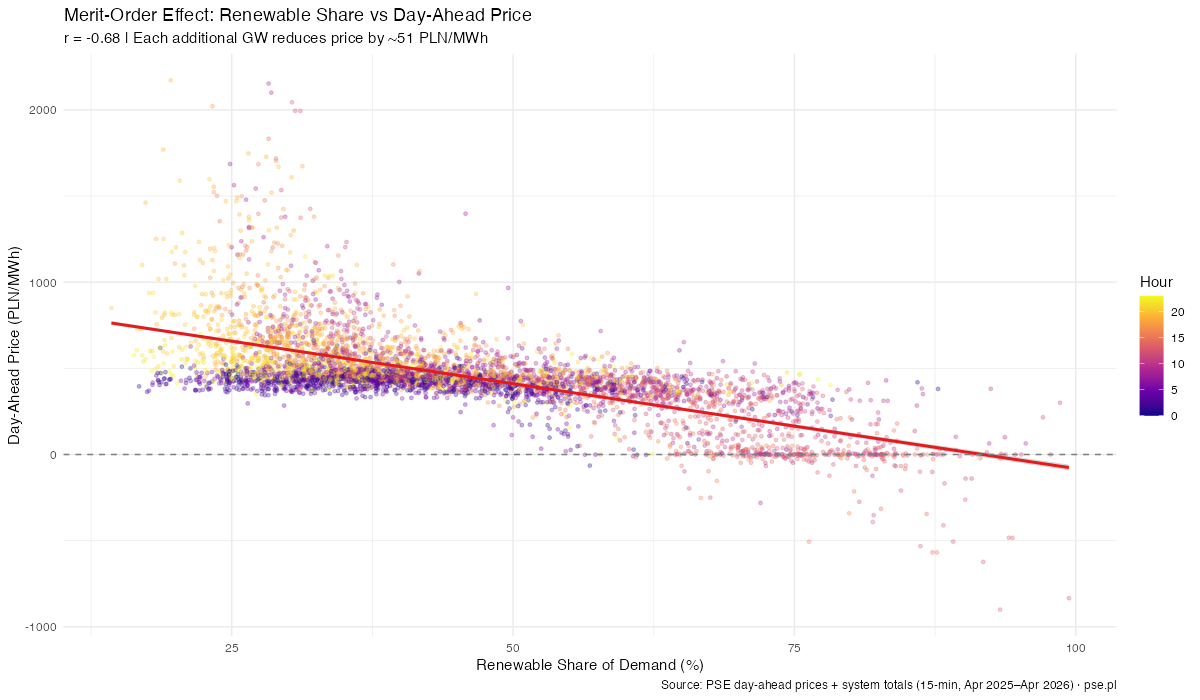
A simple regression controlling for demand gives the key number: each additional GW of renewable generation reduces the spot price by 51 PLN/MWh (roughly 12 EUR/MWh).
The effect is dramatic at the extremes:
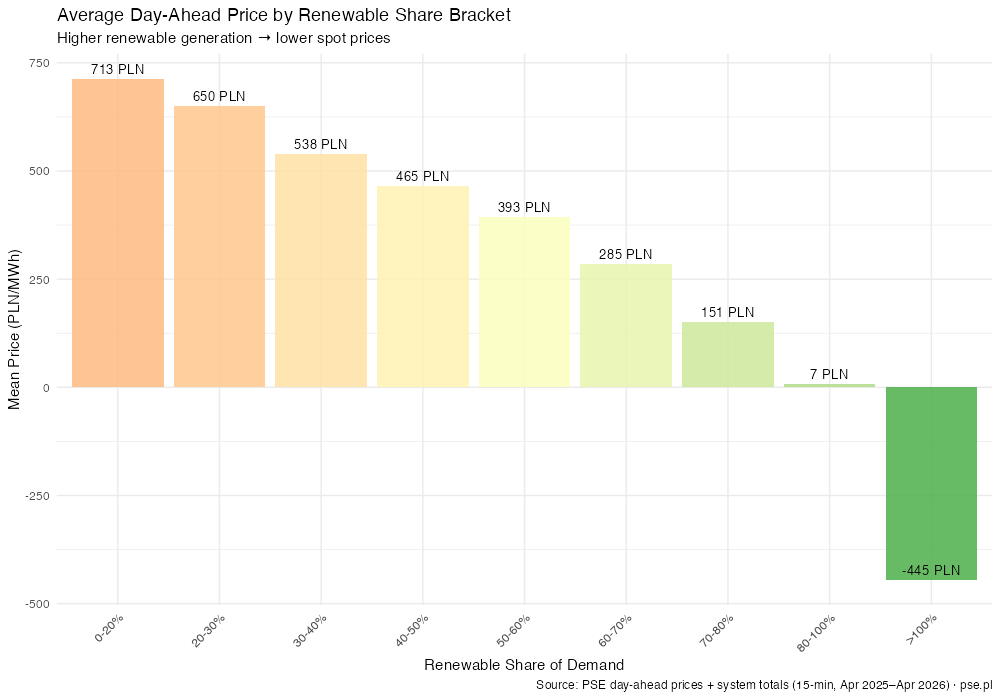
| Renewable share | Average spot price | Negative price frequency |
|---|---|---|
| 0-20% | 713 PLN/MWh | 0% |
| 40-50% | 465 PLN/MWh | 0.03% |
| 70-80% | 151 PLN/MWh | 19% |
| 80-100% | 7 PLN/MWh | 44% |
| >100% | -445 PLN/MWh | 86% |
When renewables exceed 80% of demand, the average price collapses to nearly zero. When they exceed 100%, prices go deeply negative — the grid is literally paying consumers to take electricity.
3.5% of all 15-minute intervals in the year had negative prices. That’s 1,238 intervals, or about 310 hours.
This is the “merit-order effect” that energy economists have documented across Europe: zero-marginal-cost renewable generation displaces expensive fossil fuel plants from the supply stack, pushing down the clearing price. Poland’s -51 PLN/MWh per GW is comparable to Germany’s effect circa 2015, suggesting Poland is at a similar inflection point.
Finding 3: Renewable intermittency is NOT the main driver of balancing costs
This was the most surprising finding. The popular argument goes: renewables are variable, so the grid needs expensive fast-ramping backup, driving up balancing costs. The data says otherwise.
I compared the balancing market spread (RCE minus day-ahead price) with renewable ramp rates and found essentially zero correlation (r = 0.05). When solar drops 2 GW in 15 minutes, balancing costs don’t spike. When wind ramps up 3 GW, the spread doesn’t widen.
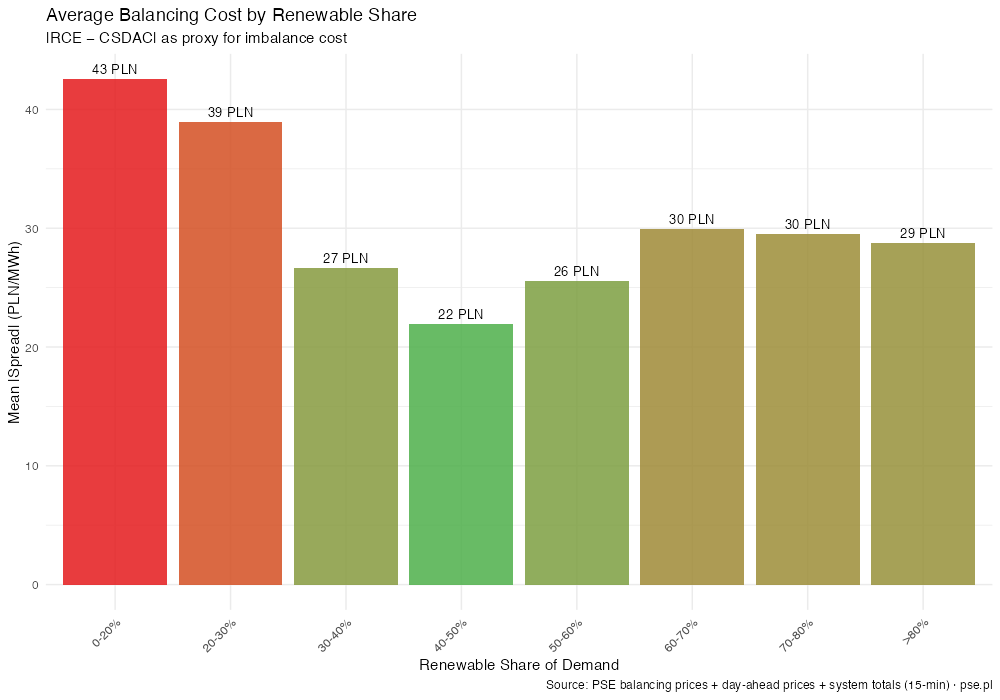
The average absolute spread hovers around 28 PLN/MWh regardless of how much renewable generation is on the grid. Why?
Three likely explanations:
Renewables are well-forecasted. PSE knows tomorrow’s solar and wind profile with decent accuracy. The day-ahead schedule already prices in the variability, so real-time surprises are small.
Conventional outages dominate. An unexpected coal plant trip removes 500-900 MW instantly — far more disruptive than a gradual solar ramp that the grid operator can see coming 24 hours in advance.
The grid adapted. Poland’s conventional fleet has learned to follow the renewable pattern. Gas peakers and flexible coal units have adjusted their operating profiles.
This doesn’t mean intermittency is free. But the data suggests its cost is far smaller than the “intermittency premium” assumed in most Polish energy debates. The real balancing cost drivers are legacy issues with the conventional fleet, not renewable variability.
Finding 4: The optimal wind/solar ratio is 37/63 — and Poland is close
Given the observed generation profiles and demand shape, I swept wind/solar capacity ratios from 0:100 to 100:0 to find the mix that minimizes residual demand variance (the smoothest net load for conventional plants to follow).
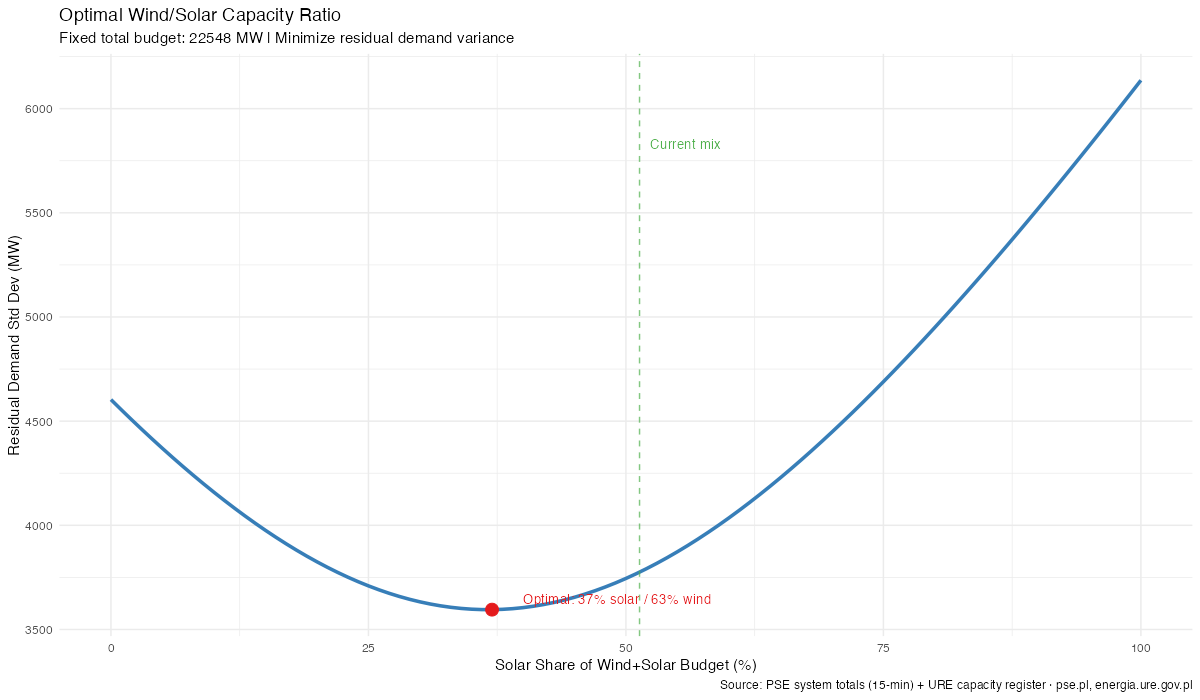
The optimal split is 37% solar / 63% wind — more wind-heavy than the current 51/49. But the improvement is only 4.6% in residual demand variance. The curve is remarkably flat between 30-45% solar, meaning the system is robust to moderate allocation changes.
Why does more wind help?
- Wind generates at night (~25% capacity factor at night vs 0% for solar)
- Wind generates in winter (23-26% CF when solar drops to 10-16%)
- Wind has lower ramp rates (more predictable for grid operators)
That said, the current 51/49 split is already in the flat zone of the efficiency curve. Poland doesn’t need to radically rebalance — it needs more of both, especially wind, which the 10H distance rule has suppressed for a decade.
Finding 5: Poland imports from everyone
Cross-border flow data (Aug 2025 – Apr 2026) shows Poland is a net importer from all six neighbors:
| Neighbor | Average flow | Direction |
|---|---|---|
| Germany | -1,394 MW | Always importing |
| Czech Republic | -966 MW | Always importing |
| Slovakia | -484 MW | Almost always importing |
| Sweden | -316 MW | Mostly importing |
| Ukraine | -255 MW | Mostly importing |
| Lithuania | -130 MW | Almost always importing |
| Total | -3,545 MW |
Poland averages 3.5 GW of net imports — roughly the output of 3-4 large coal plants. The interesting part is the correlation with renewables: when Polish renewable output is high, imports from Germany decrease (r = +0.33), but imports from Czech Republic increase (r = -0.52).
The German pattern makes sense — both countries’ renewables correlate (similar weather), so when Polish solar peaks, German exports also drop. The Czech pattern likely reflects nuclear baseload filling different gaps in the merit order.
The duck is coming
Poland shows a clear duck curve pattern — the shape of net load (demand minus renewables) across the day:
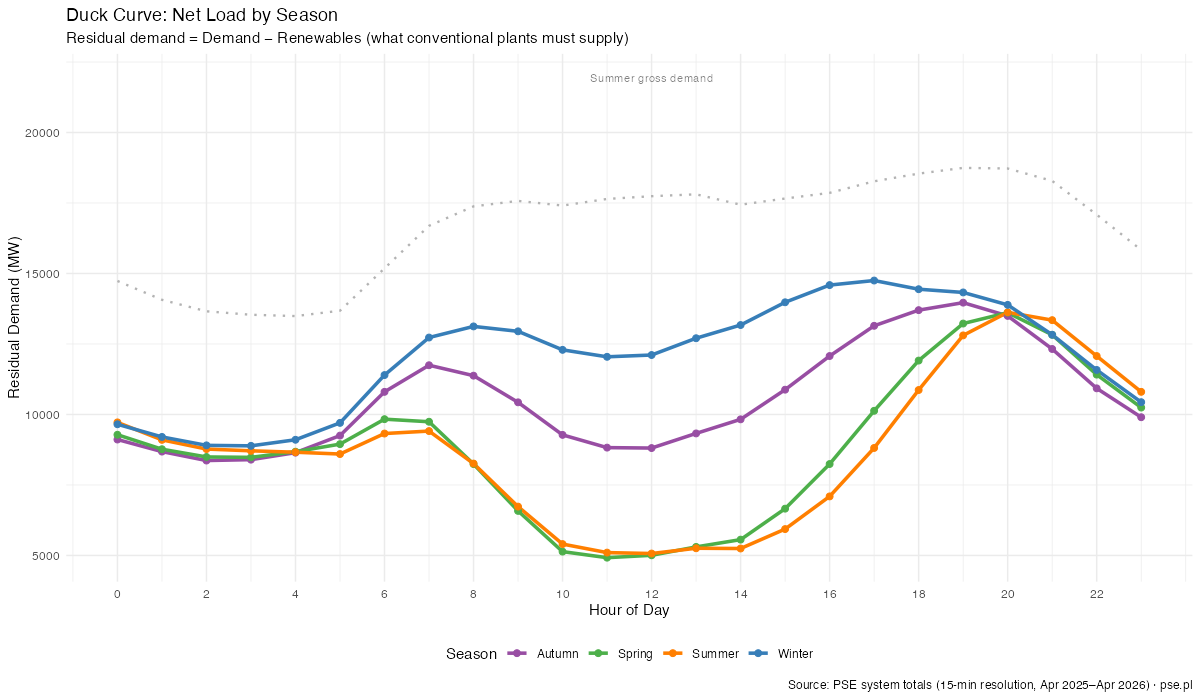
In summer, the midday “belly” drops to ~5,500 MW of residual demand as solar peaks, then ramps up 4,500 MW to meet the evening peak. In winter, the curve is flatter (less solar impact) but the absolute level is much higher.
The summer duck is still mild compared to California or Australia, but it’s growing. Each GW of new solar deepens the belly. At some point — probably around 50-60% average renewable share — storage becomes essential to shift the midday surplus to the evening deficit.
What this means
Poland’s energy transition is real, measurable, and more advanced than most domestic discourse suggests. The grid already operates with renewables as the dominant source for over a third of all hours. The market data shows this is good for electricity prices.
The binding constraint isn’t capacity — it’s flexibility. Poland has enough renewable nameplate (25 GW) to cover roughly half of its ~17 GW average demand. But the temporal mismatch between solar’s midday peak and demand’s evening peak means the value of the next GW of solar is declining, while the value of the next GW of wind (which generates at night, in winter, more steadily) is holding up.
The three things that would move the needle most:
More onshore wind. The optimal mix has Poland at 63% wind / 37% solar, but the 10H rule has throttled wind development since 2016. Every year of regulatory delay costs Poland roughly 7 billion PLN in higher electricity prices.
Grid-scale storage. The 275 hours per year at >80% renewable share represent energy that’s currently being curtailed or exported at negative prices. Even modest battery storage would capture this surplus and shift it to the expensive evening hours.
Better interconnections. Poland’s 3.5 GW of constant imports suggests the transmission infrastructure to neighbors is well-utilized. More cross-border capacity would help smooth renewable variability across a wider geographic area.
The data is public. The math is straightforward. The transition is already happening — the question is whether policy will accelerate it or hold it back.
Technical details
All analysis code is available in the renewable-capacity project. 11 R scripts, 24 plots, full methodology in REPORT.md.
Data sources:
- URE OZE capacity register — Dec 31, 2025 snapshot
- PSE system data — 15-minute resolution, system totals, day-ahead prices, balancing prices, cross-border flows