Miasteczko.jl
Bottom-up transport planning for Polish towns — simulate demand first, design supply second. 266 corridors discovered automatically from a gravity model over real OSM data.
Goal
Design public transport networks from the ground up: simulate how people actually move, then build routes that serve that demand. The opposite of the usual top-down approach where planners draw lines on a map and hope ridership follows.
The library works at two scales — town-level (MicroSim) and regional (MacroSim) — both built on real OpenStreetMap data for Polish settlements.
Approach
MicroSim — how does this town move?
Per-person, per-minute simulation of a single town:
- OSM extraction — buildings, roads, points of interest, rail stations from a Poland PBF file (a compact binary format for OpenStreetMap data)
- Population synthesis — households placed in real residential buildings, workers assigned to workplaces, students to schools (GUS census demographics)
- Activity simulation — agents follow daily schedules driven by a needs system (hunger, energy, social). 60-second tick resolution over multiple days.
- Demand aggregation — individual trips become an origin-destination (OD) matrix by zone and time-of-day
- Bus network generation — greedy stop placement at intersections, demand-driven route building, overlap detection, express routes for long corridors
- Timetable generation — per-route demand-proportional departures, bidirectional schedules, timed transfer hubs (Taktfahrplan-style pulse — a Swiss method where all lines meet at hubs simultaneously)
- Feedback loop — simulate with transit → measure ridership → adjust timetable → repeat until stable
Mode choice is probabilistic (logit model) across walk, bike, e-bike, bus, and car — using actual road network distances, weather conditions, and trip chaining (if you bused to work, you bus back).
MacroSim — how does this region connect?
Regional-scale simulation where vehicles (trains) are the agents, not people:
- Settlement graph — 2,987 settlements extracted from Poland PBF, three-tier hierarchy (cities >50k, towns 5–50k, villages <5k)
- Corridor discovery — 109 backbone + 157 feeder = 266 corridors found automatically from rail connectivity (see examples below)
- Gravity demand model — OD matrix with population-based attraction, distance decay, and employment scoring from OSM amenity density
- 10-pulse system — composable demand generators (morning commute, school, university weekly, shopping, nightlife, healthcare, leisure, family visits). Each pulse fires on specific day types — the simulation distinguishes 4: regular weekday (Mon–Thu), Friday (university exodus + nightlife), Saturday (shopping peak), and Sunday (leisure + family). Averaging into just “weekday” and “weekend” would hide real phenomena like the Friday afternoon wave of students heading home.
- Vehicle simulation — deterministic train traversal with capacity constraints and automatic relief train insertion
- Junction transfers — detect stations on 2+ corridors, route transfer demand through them with 5-minute penalty, align timetables at junctions
Calibrated against Poland PBF to produce 3.8M daily passengers — intentionally optimistic for a green transport scenario.
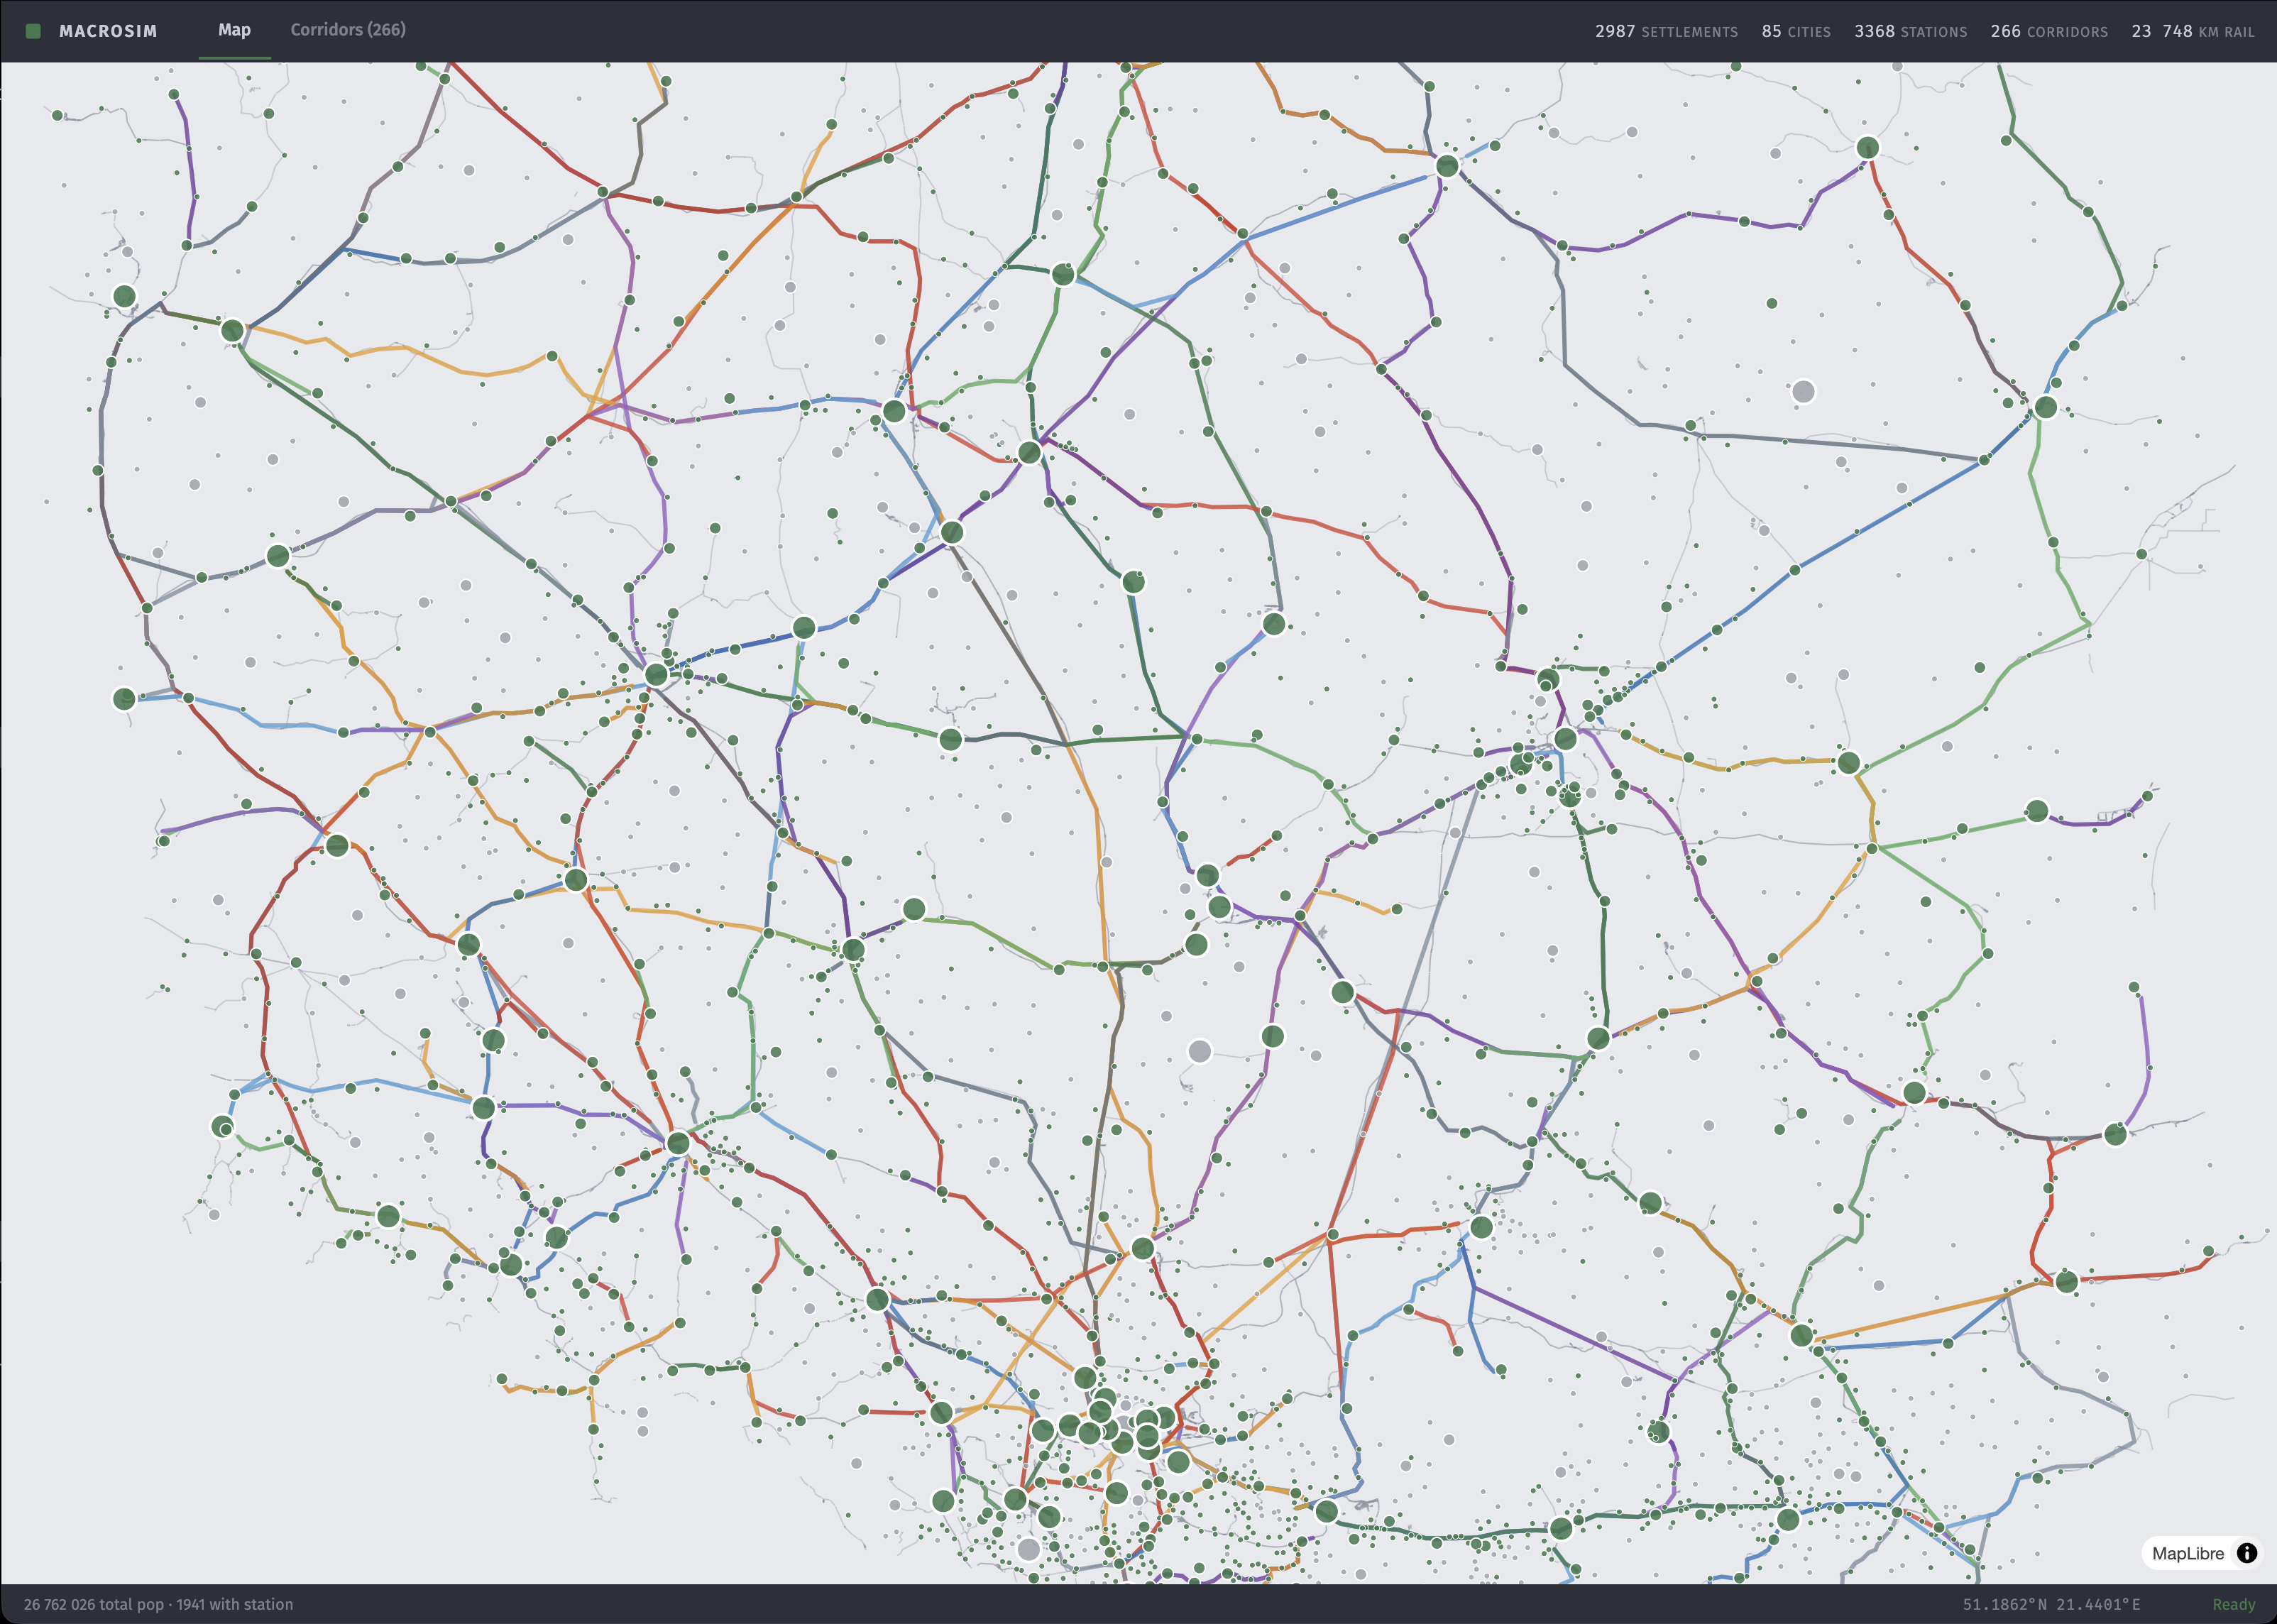
Corridor discovery
The system discovers rail corridors automatically from OpenStreetMap track connectivity — no manual line definitions, no PKP data. It finds city-to-city paths through the station graph, then generates feeder corridors from uncovered towns to their nearest city.
Top 5 discovered corridors by length:
| Corridor | Distance | Stations |
|---|---|---|
| Szczecin — Gdańsk | 356 km | 52 |
| Łódź — Gdańsk | 352 km | 45 |
| Elbląg — Łódź | 334 km | 43 |
| Gliwice — Warszawa | 333 km | 51 |
| Ełk — Gdańsk | 327 km | 52 |
These roughly match real PKP lines — without being told they exist. The gravity model then assigns demand to each corridor based on population and distance.
Validated on Poland PBF, commit 4fc5d0f (2026-04-18).
Economics module
Full financial modeling per route: distance-based fares (power-law), fuel/energy costs (diesel and electric), CO₂ accounting with car-counterfactual savings, and four subsidy types (deficiency grant, per-passenger-km, CO₂ bonus, accessibility bonus for underserved areas).
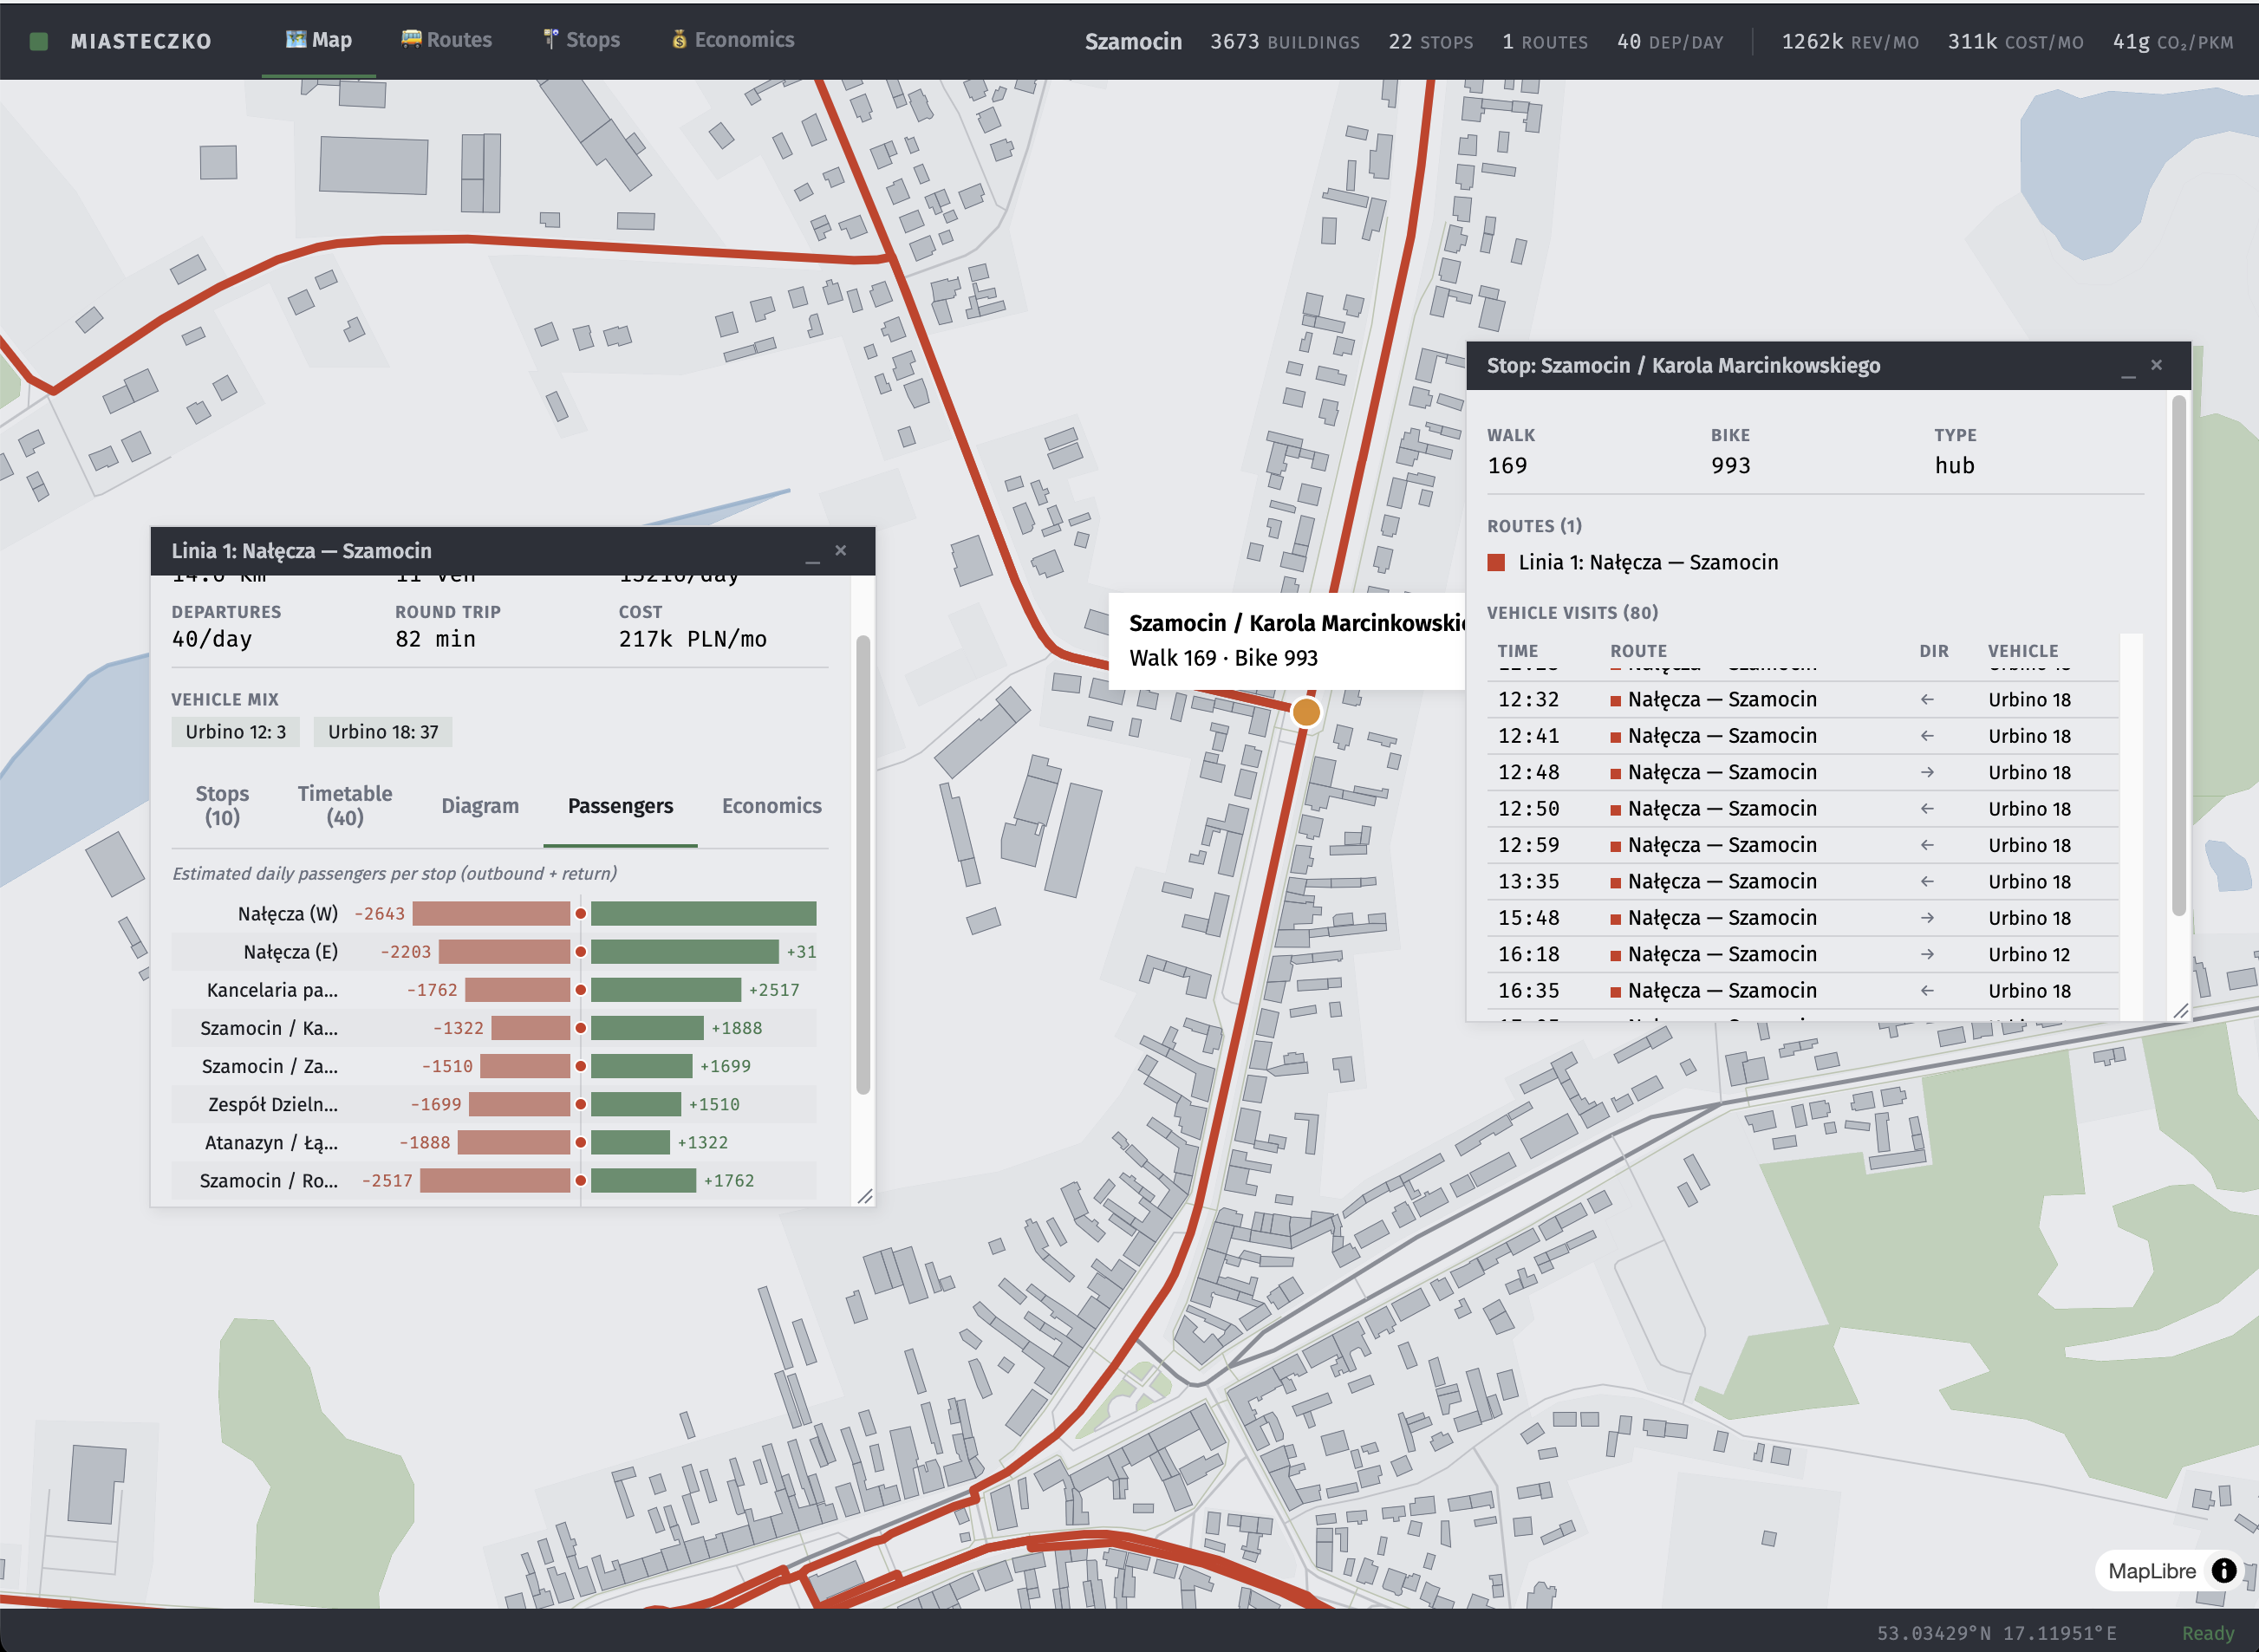
UI — Desktop preview app
The presentation layer went through several iterations. First attempt was CImGui (immediate-mode GUI with GLFW/ModernGL) — functional but limited for map-heavy workflows. A quick Bonito.jl proof-of-concept validated that Electron + web rendering was the right direction. The production app landed on React + TypeScript + MapLibre + Oxygen.jl + Electron.
The app is a submodule (supapp/lib) primarily used for presenting simulation results: MapLibre maps, floating detail windows, sortable data tables, route/stop/vehicle detail panels, time-distance diagrams, passenger flow charts, and a system-wide economics dashboard. The Julia backend serves a JSON API via Oxygen.jl, so generated results can also be integrated with other frontends through the web server.
UI — Isometric city renderer (in progress)
IsoRender module — a proof-of-concept to render towns in a Simutrans/OpenTTD-style isometric view using real OSM geometry. Unlike those games, it doesn’t snap to a tile grid — buildings and roads keep their actual footprints, projected into 2:1 dimetric perspective. Built with Luxor.jl (Cairo), using building extrusion for 3D appearance and painter’s algorithm depth sorting. Outputs high-resolution PNG images.
Outcome
- 17 modules, 3,900+ tests, all passing
- Validated on three towns: Szamocin (17k), Chodzież (64k, 3 rail stations), Margonin (22k)
- MacroSim pipeline runs on full Poland PBF — 266 corridors, 92 semi-fast + 23 express service patterns
- MicroSim feedback converges in 2–3 cycles to stable timetables
- Three train models with physics-based travel times (EN57, Elf 2, SA134)
What I learned
- Bottom-up transport planning produces surprisingly reasonable networks — the gravity model discovers corridors that roughly match real PKP lines, without being told they exist
- Mode choice modeling is extremely sensitive to small parameter changes — distance decay β controls how fast demand drops with distance (higher β = people less willing to travel far). A 0.1 shift can flip 20% of trips between bus and car
- The pulse system for demand generation is more expressive than expected — composing 10 independent travel patterns across 4 day types captures real phenomena that a simple weekday/weekend split would miss
- Julia’s type system and multiple dispatch made the module architecture natural — each module produces typed structs, the next module consumes them, no serialization layer needed